Case studies

Closed trades, annotated by the system.

When a live position fully closes, the engine renders a chart of what actually happened — entry, opening stop, each target that paid, the final exit, and a post-trade note retelling the original thesis. These are drawn from the live ledger, unedited: prices, sizes and timestamps are the recorded fills. Losses are included, because a gallery of winners is marketing, not evidence.

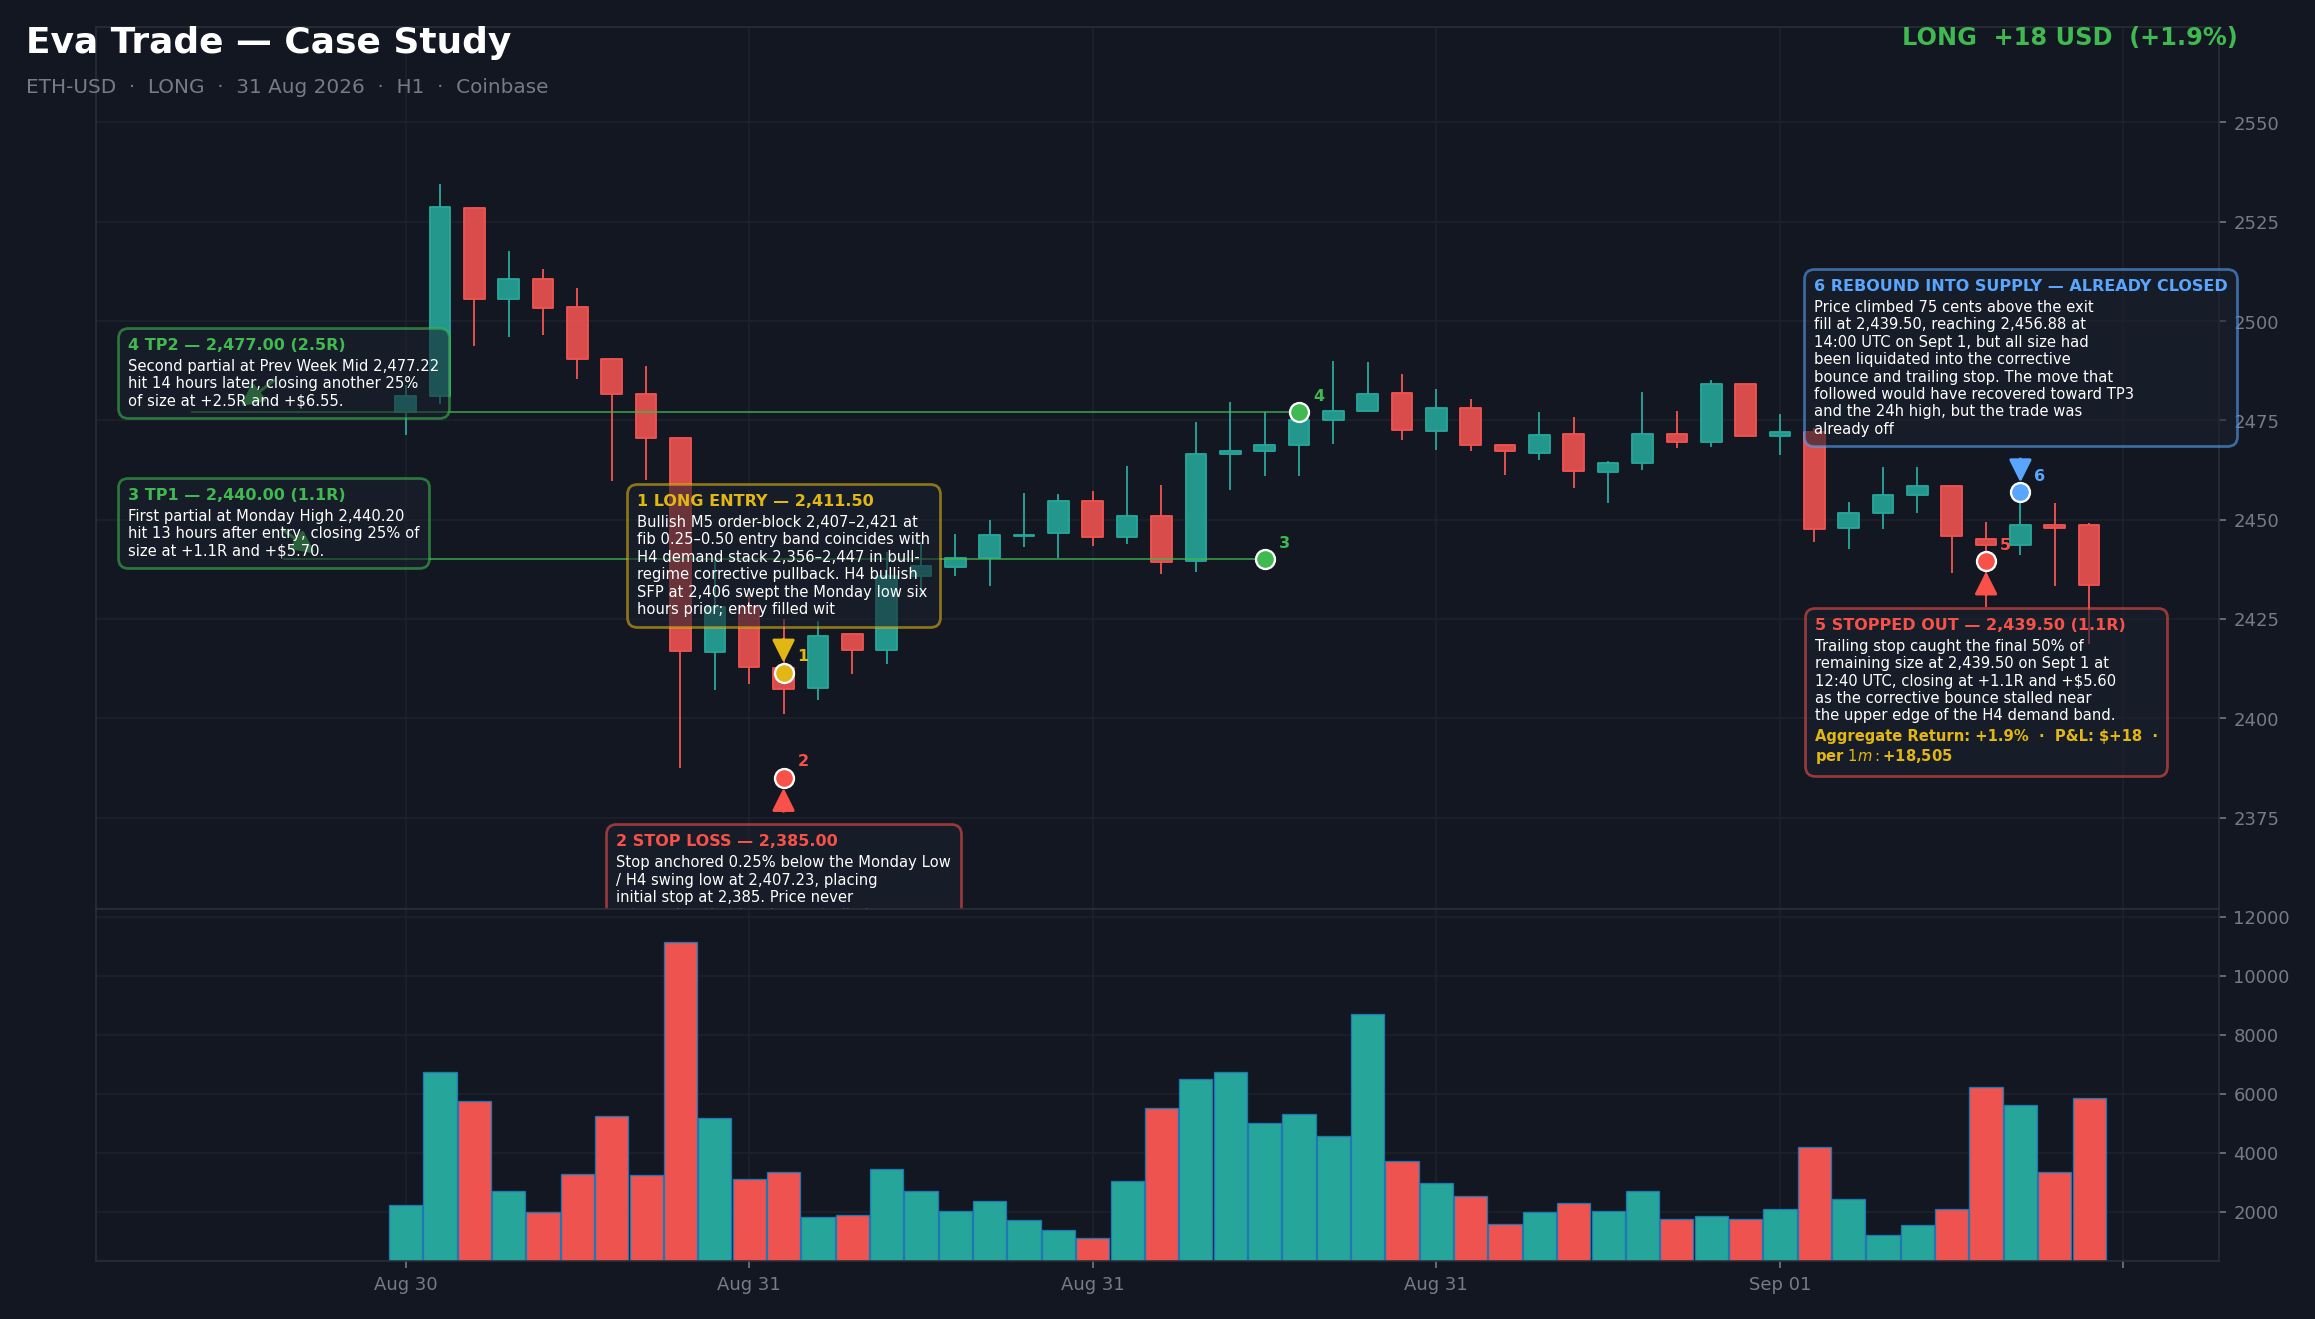
Annotated close chart for ETH long — stacked H4 demand, laddered out into strength
ETH-USD · long · opened 2026-08-31 · held 35h

ETH long — stacked H4 demand, laddered out into strength

Entry2,411.5 Targets2,440 / 2,477 / 2,534 Result +$17.85

The read. Two bullish H4 order blocks sat stacked directly below price after a corrective grind, with an H4 sweep-failure at the lows and the weekly open framing the demand pocket. The read: a bull-regime correction finishing its work into demand, not a trend change.

What happened. Price lifted out of the zone the next session. The first two targets paid at 2,468.5 and 2,477.0, and the remainder was closed as the move stalled — a laddered exit rather than a single all-or-nothing print.
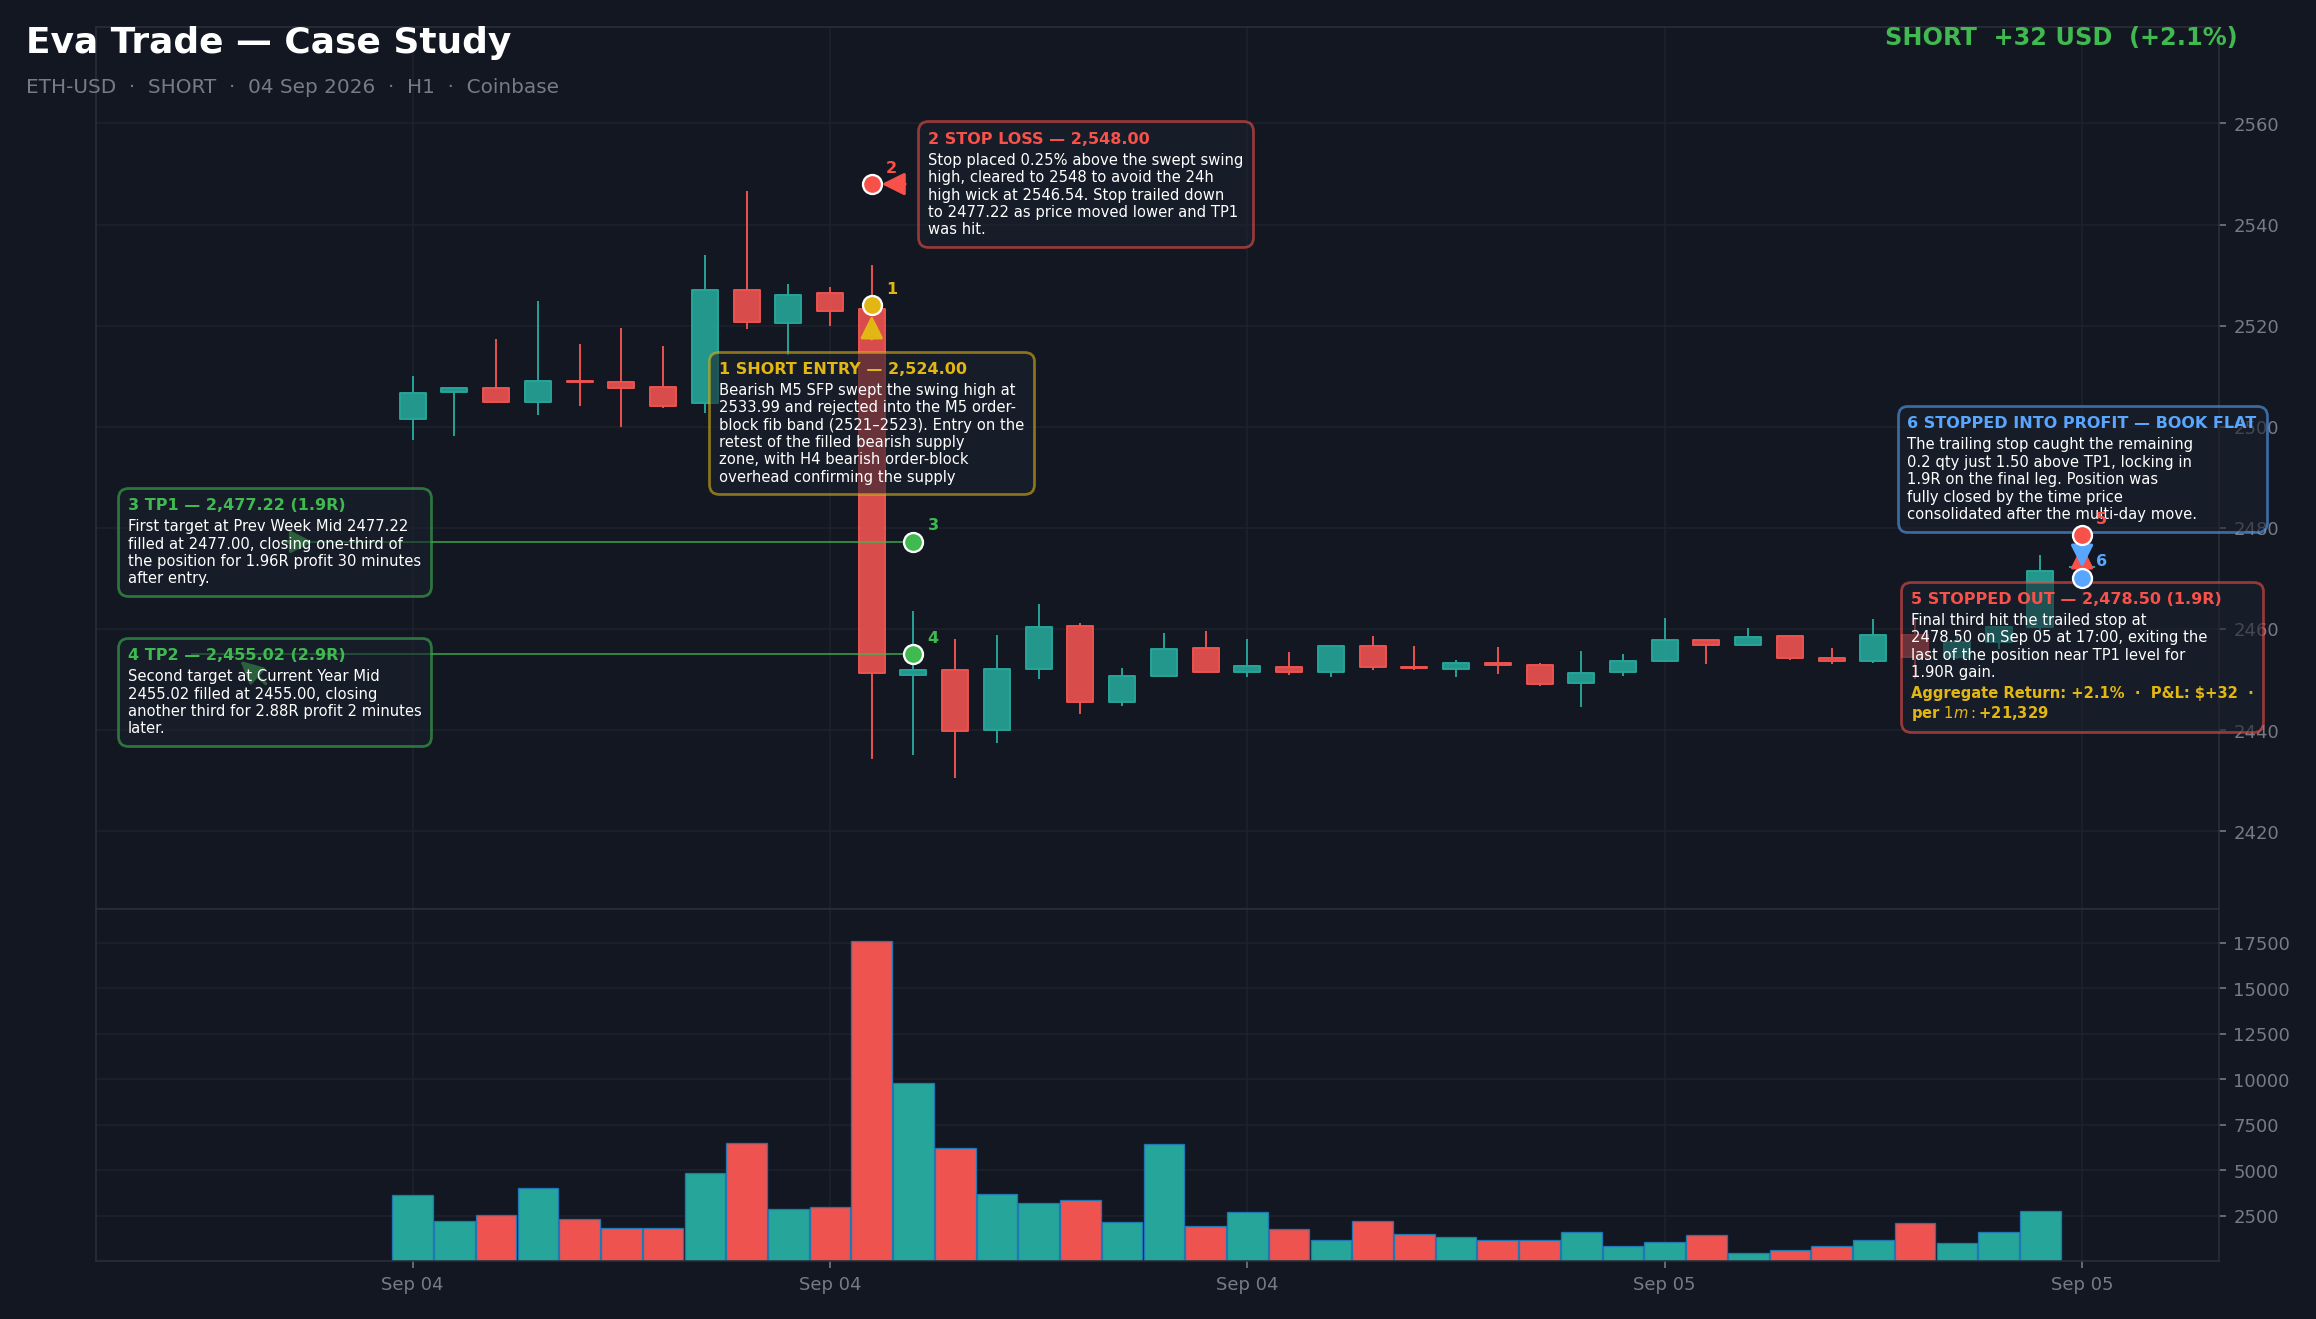
Annotated close chart for ETH short — supply retest filled, two targets in half an hour
ETH-USD · short · opened 2026-09-04 · held 29h

ETH short — supply retest filled, two targets in half an hour

Entry2,524 Stop2,548 Targets2,477.22 / 2,455.02 / 2,416.8 Result +$32.30

The read. An unmitigated H4 bearish order block at 2,479–2,534 had capped price since Aug 30, and the 24-hour high at 2,546 tagged the supply retest zone two bars before entry — bears had already defended the level. The short was placed inside that supply with the stop just beyond it.

What happened. The first two targets filled within 32 minutes of entry at 2,477 and 2,455. The stop then trailed behind the banked gains, and the remaining clip was tagged out a day later at a profit — the trade's worst case had long since become a win.

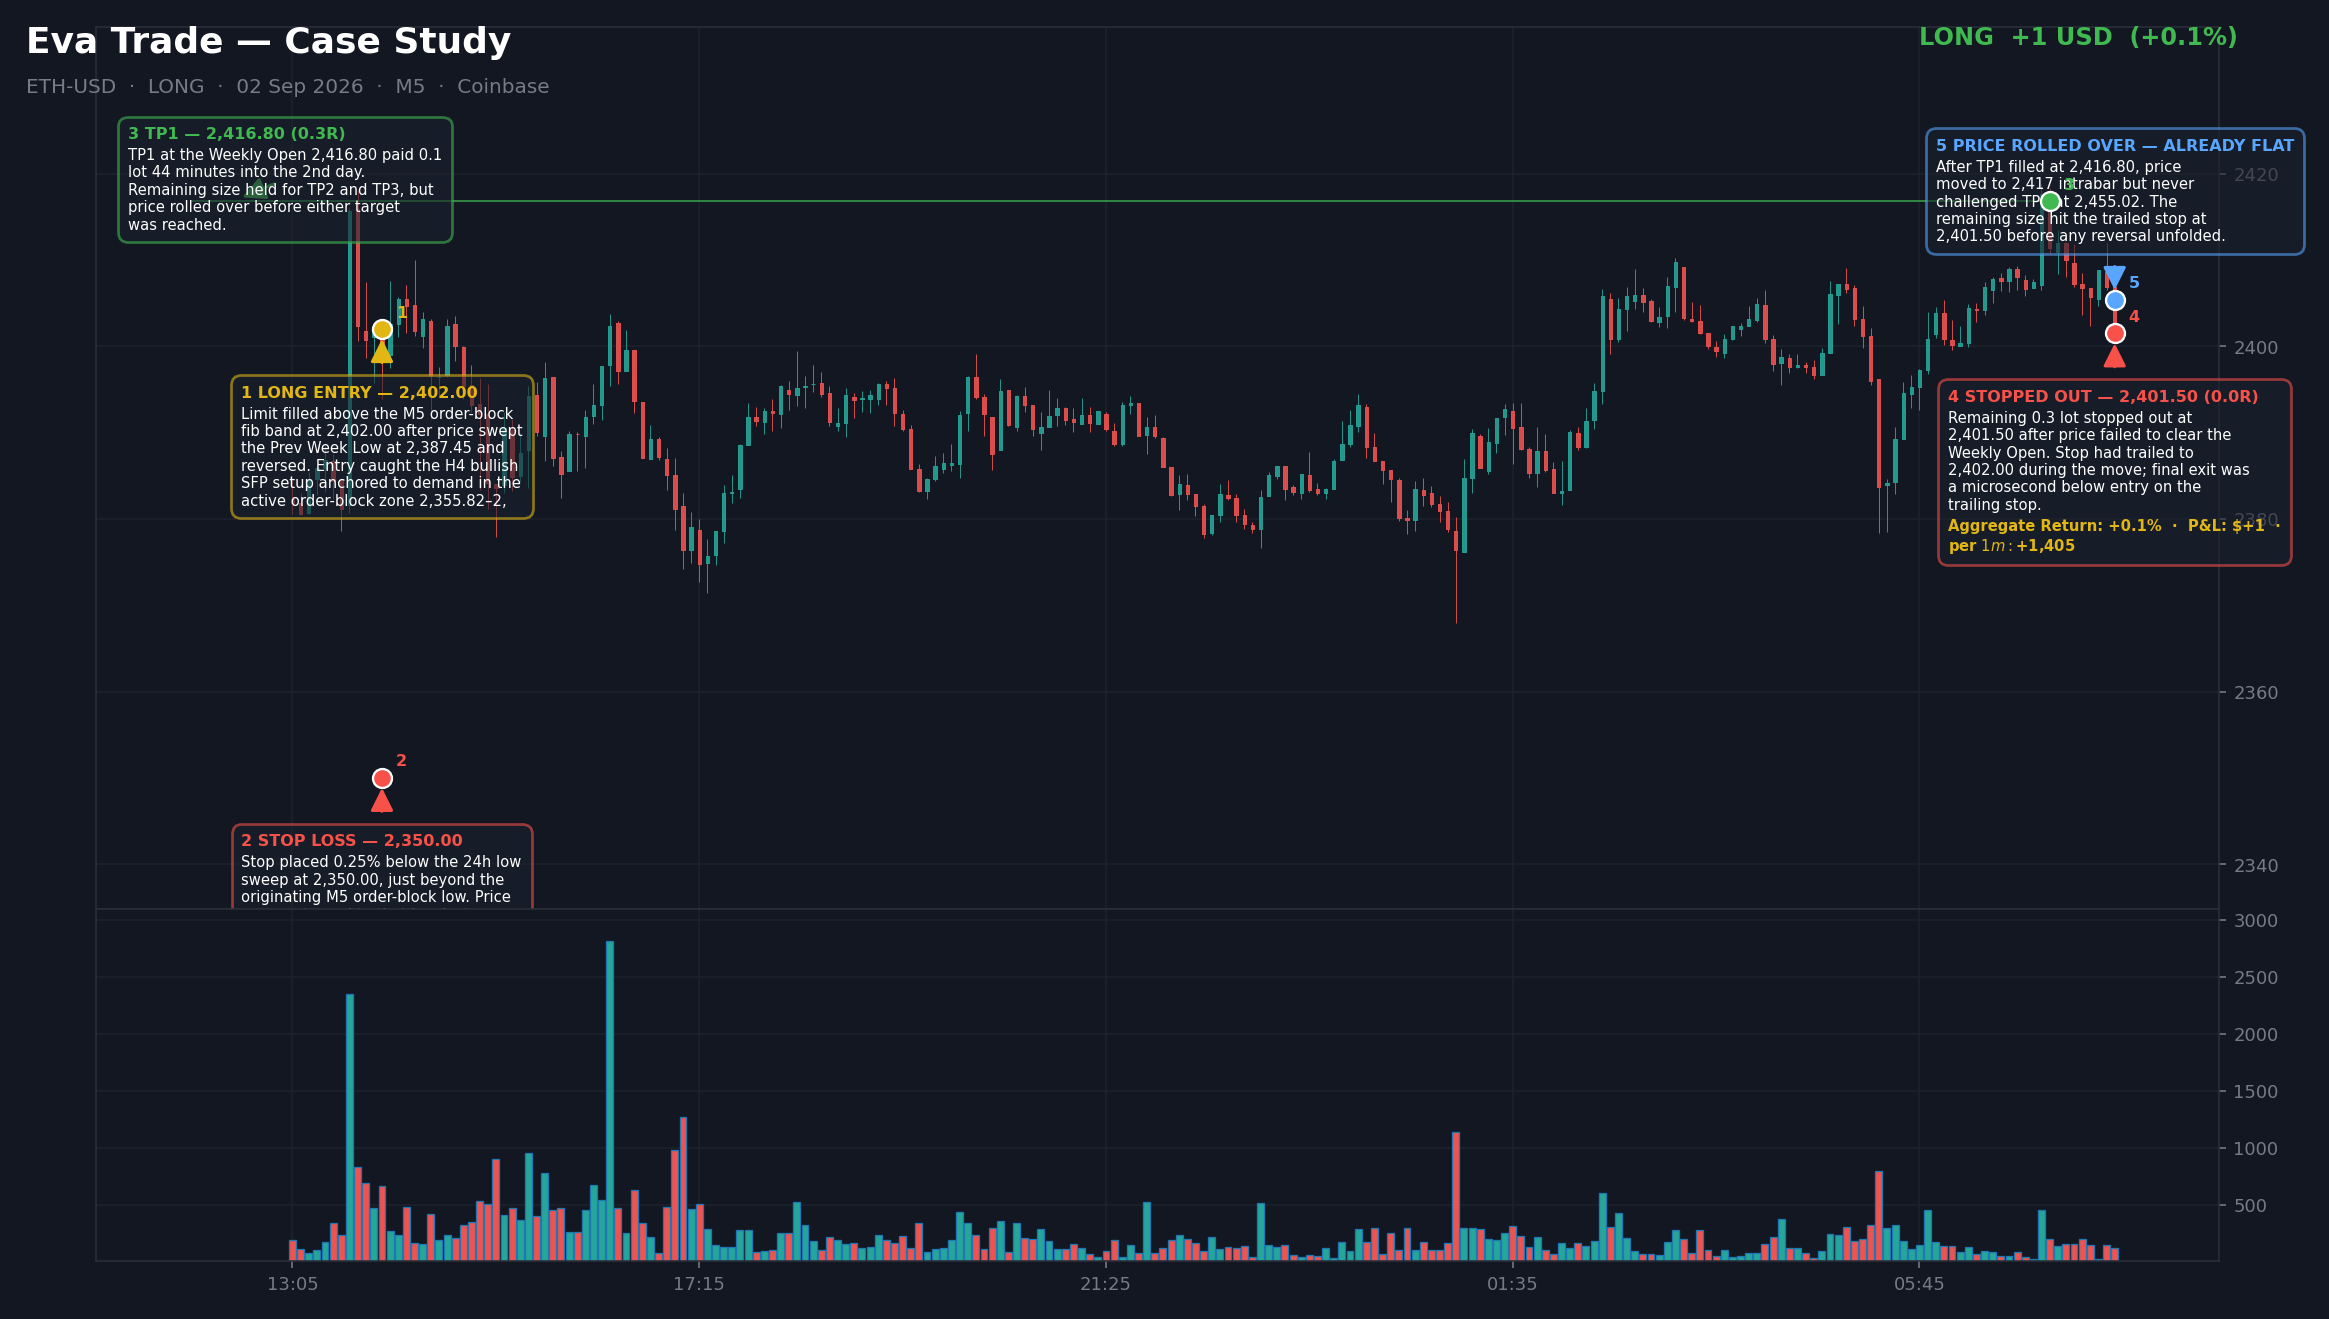
Annotated close chart for ETH long — demand held, and the ladder protected a fading move
ETH-USD · long · opened 2026-09-02 · held 18h

ETH long — demand held, and the ladder protected a fading move

Entry2,402 Stop2,350 Targets2,416.8 / 2,455.02 / 2,477.22 Result +$1.35

The read. Price dipped back into the active H4 demand block at 2,356–2,417 three hours after printing the 24-hour low, with an H4 sweep-failure at the level. The plan bought the retest of demand with targets back at the weekly open and above.

What happened. The first target paid at 2,417. The move then faded, and the trailed stop closed the rest at entry. A read that only half-worked still ended green — that is what the ladder and the trailing stop are for.

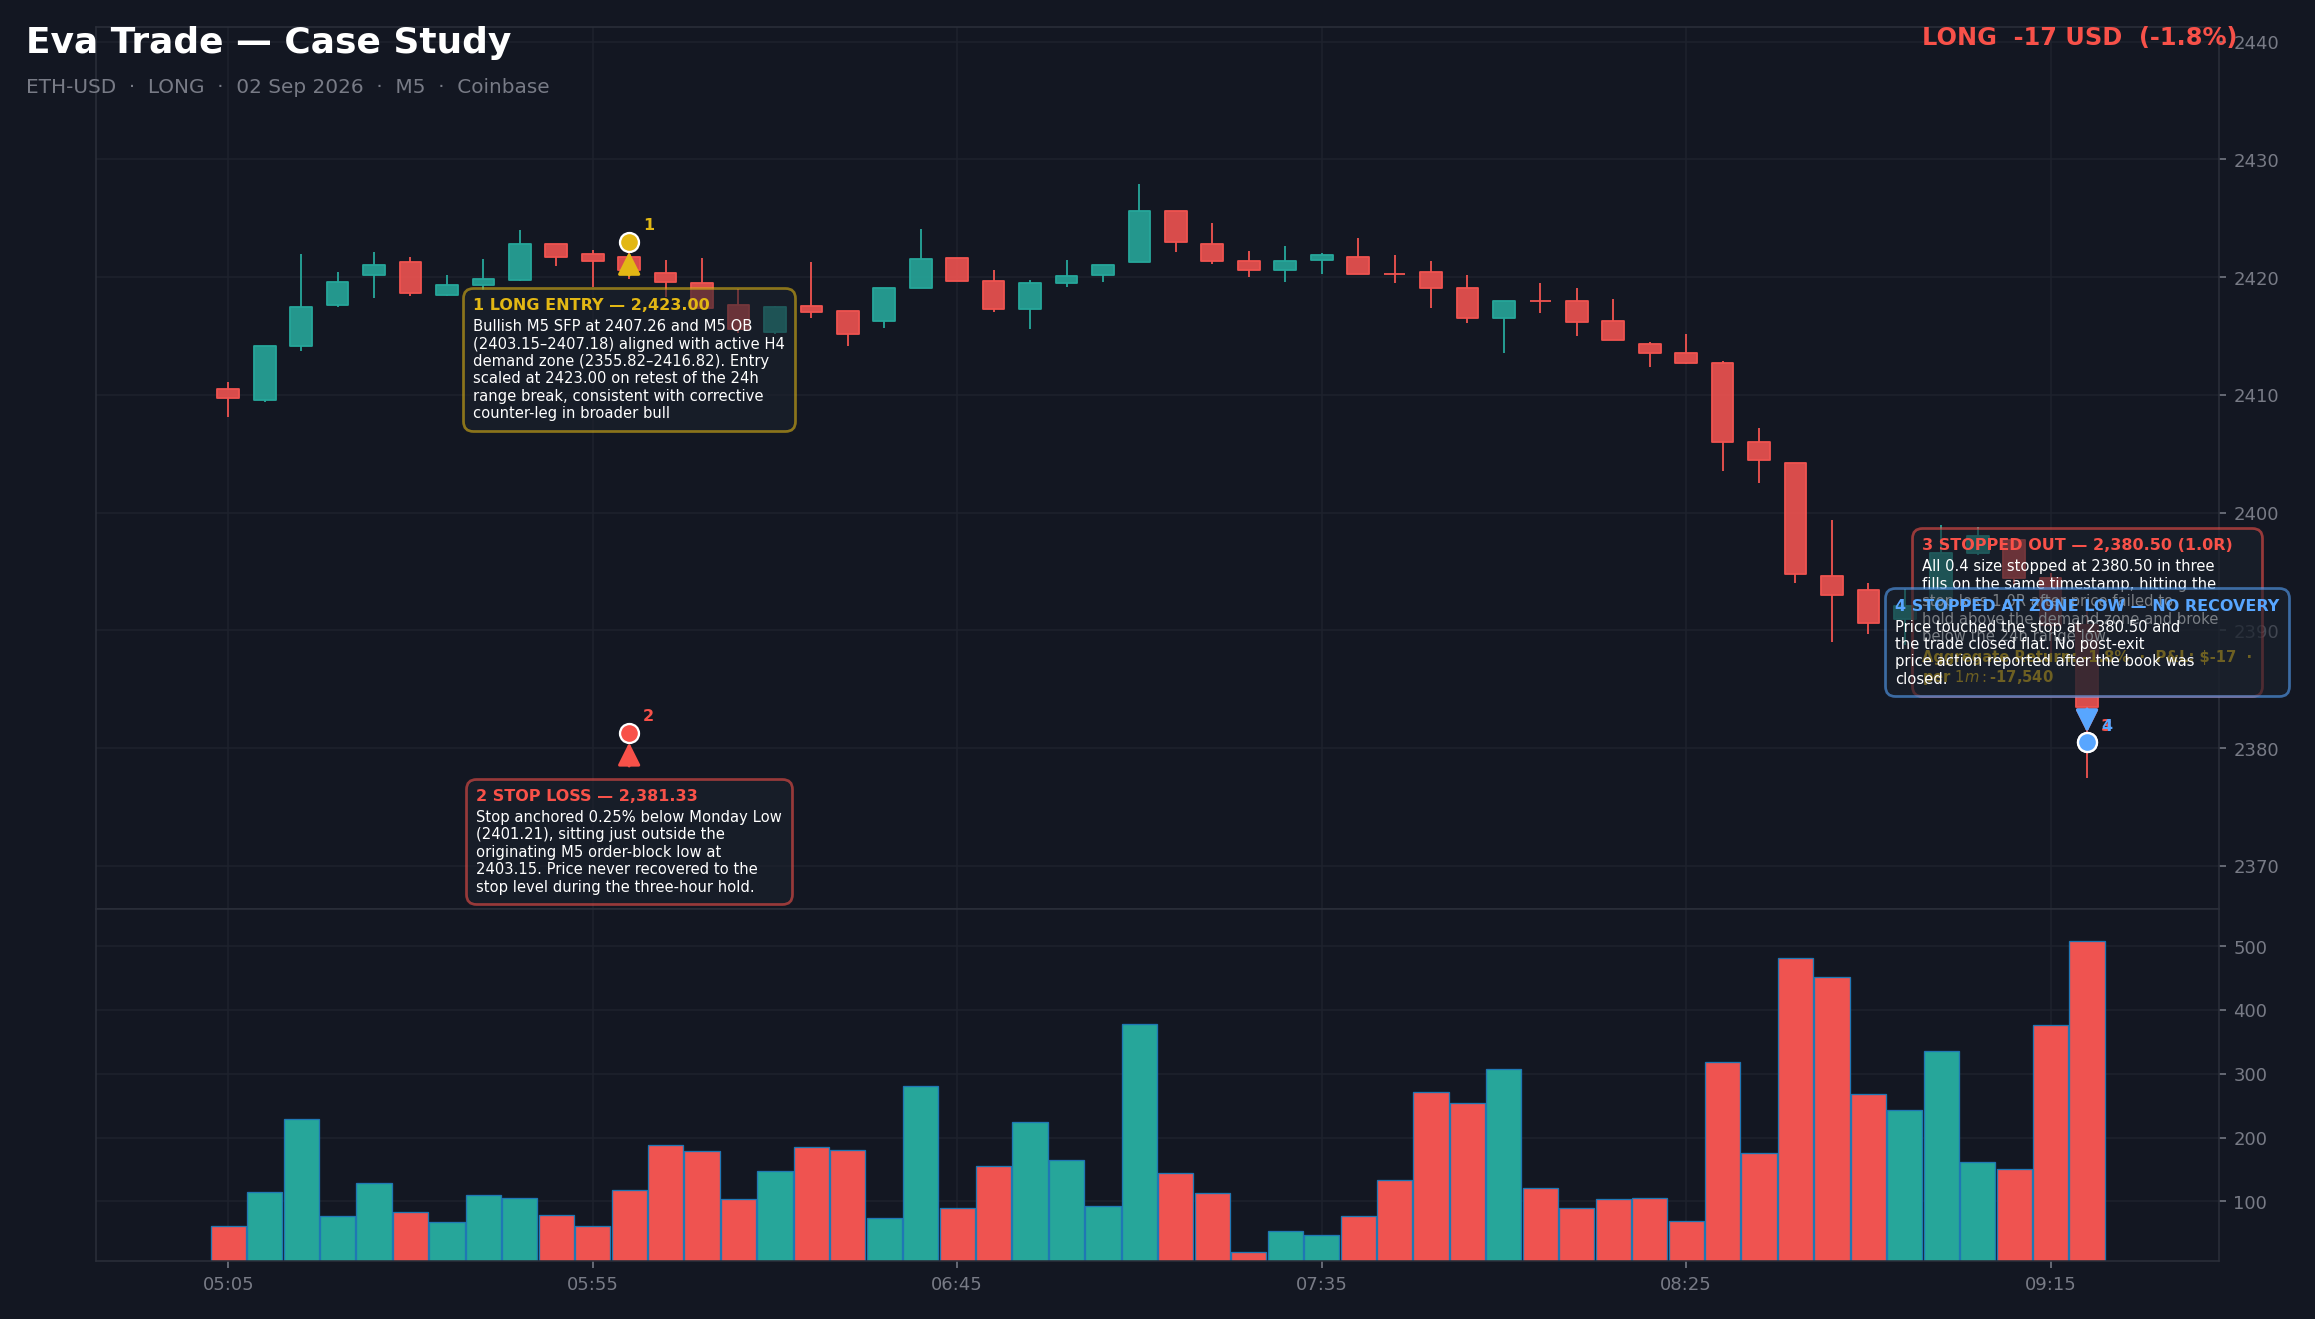
Annotated close chart for ETH long — stopped. The risk was written down before entry
ETH-USD · long · opened 2026-09-02 · held 3.4h

ETH long — stopped. The risk was written down before entry

Entry2,423 Stop2,381.33 Targets2,445.56 / 2,466.84 / 2,489.9 Result ($17.00)

The read. Price had broken below the 24-hour range low and recovered back above the weekly open, with an M5 sweep-failure at the lows — a reclaim read: failed breakdown, rotation back through the range.

What happened. The reclaim failed. Price broke back down and the full position exited at the stop, 2,380.5, three and a half hours after entry. The loss matched the risk stated on the card at broadcast — nothing was averaged down, widened, or held past the level. Losers are published the same way winners are.

Selection note. These four are chosen to show the mechanics — a laddered winner, a trailed short, a scratch the ladder protected, and a clean stop-out — from the ICT Trades live book. The full record, including every trade not shown here, is what the beta gives you.